Dashboard
The Grizzle ZT-PAM Dashboard provides a unified view of the system’s overall status, user activities, and managed assets — all from a single screen.
This page is designed as the central control panel for security operations.
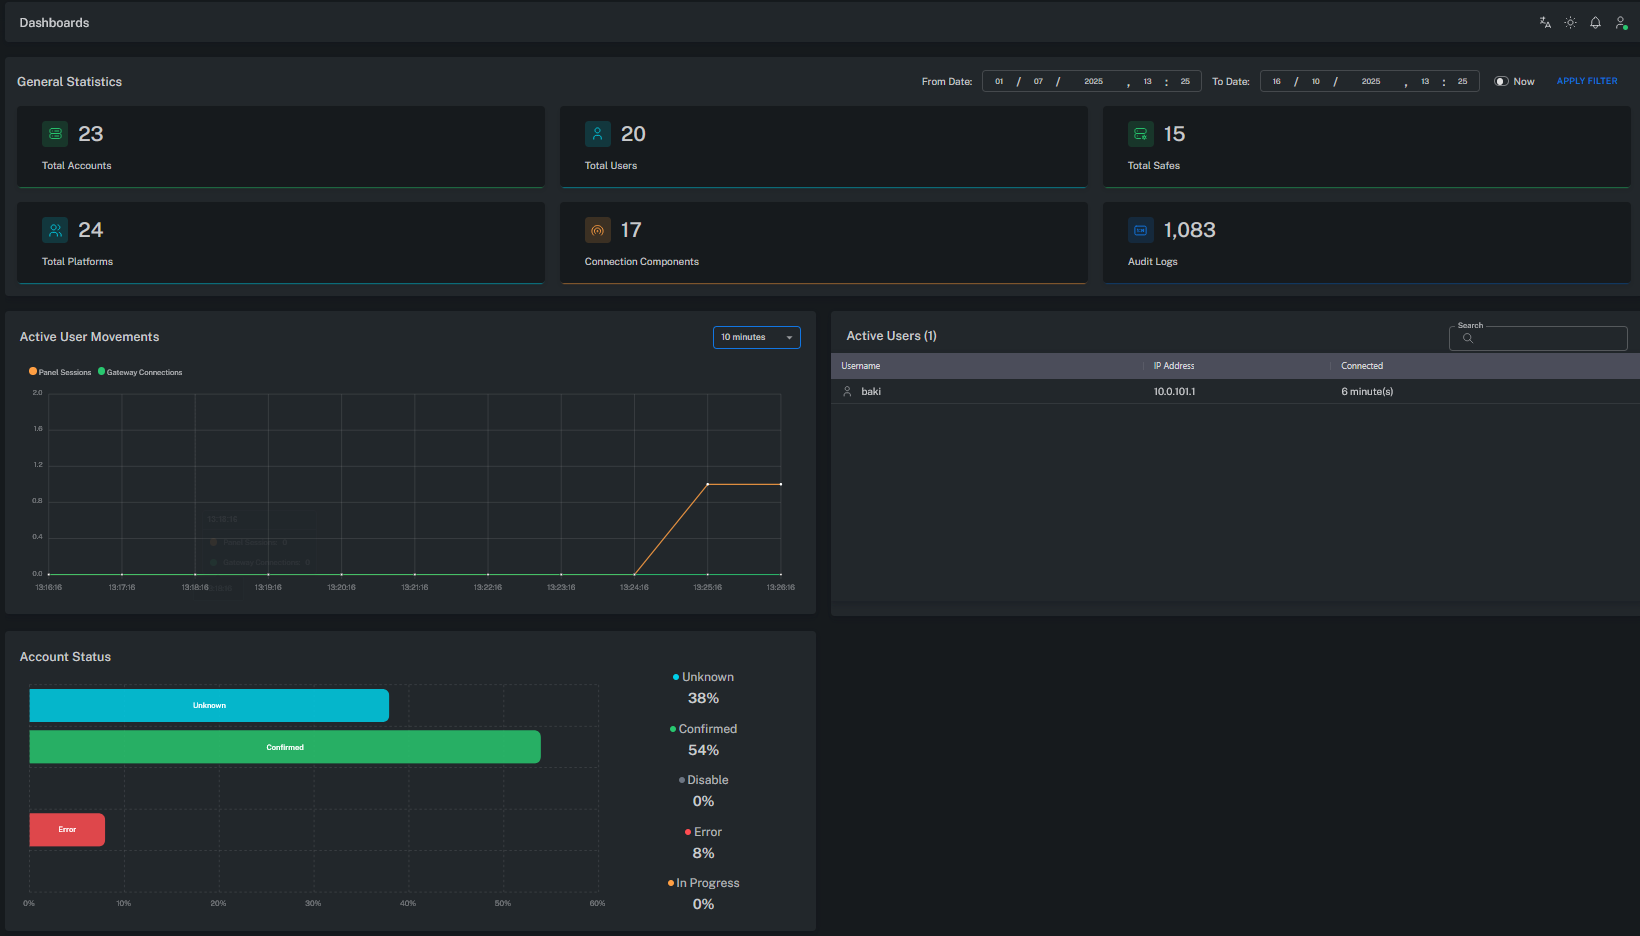
General Statistics
This section provides a numerical overview of the main components in the system:
| Title | Description |
|---|---|
| Total Accounts | Total number of privileged or service accounts managed in the Vault. |
| Total Users | Total number of users authorized to access the system. |
| Total Platforms | Number of defined platforms (Windows, Linux, Database, Network Device, etc.). |
| Total Safes | Number of secure areas (Safes) defined within the Vault. |
| Connection Components | Number of active connection modules/connectors (e.g., RDP, SSH, WebURL). |
| Audit Logs | Total number of recorded audit events. |
This area shows the overall system scale and activity level.
Active User Movements
This chart displays user sessions that occurred within a specific time range.
- Panel Sessions: Active sessions on the management (UI) panel.
- Gateway Connections: Privileged connections established through Web Gateway or PSM.
This graph is used to analyze user traffic and system utilization trends.
Active Users
This table lists users who are currently connected to the Grizzle ZT-PAM system.
| Username | IP Address | Connected |
|---|---|---|
| user01 | 10.x.x.x | Active |
| user02 | 10.x.x.x | Active |
This table shows which users are currently logged in and from which client addresses they are connected.
Account Status
Displays the distribution of account statuses managed in the Vault.
Each color represents a different state:
| Status | Description |
|---|---|
| Confirmed | Account verified, CPM management active. |
| Unknown | Not yet verified or awaiting initial check. |
| Error | Error occurred during password change or connection validation. |
| Disabled / In Progress | No active or currently processing accounts. |
This area is a critical indicator for monitoring the health of Vault accounts and CPM performance.
Date Filter
The From / To Date fields at the top of the screen define the time range for displayed statistics.
Administrators can select a specific range or use the “Now” option to view the current state.
This filter is useful for audit analysis and reviewing historical user activity.
Purpose of the Dashboard
- Monitor the overall system health in real time
- Track active users and sessions
- Analyze password management and connection statistics
- Measure system utilization through audit log volume
With this screen, administrators can instantly answer questions such as:
“How many users are active? How many accounts are managed? How many sessions are open? Are there any system errors?”
Summary
All metrics are collected from Vault, CPM, and PSM components to provide a comprehensive view of the Grizzle ZT-PAM environment.